Accuracy Considerations for UWB Indoor Tracking in an Industrial Environment
By Lubomir Mraz | October 9th, 2019 | 12 min read
There are multiple factors that make a great indoor localization system. In this article, we will focus on what we believe are three of the most critical ones: accuracy, accuracy consistency (which we will interchangeably call accuracy stability within the scope of this text) and tag battery life. Then, we would like to answer typical questions related to accuracy, mainly for UWB RTLS technology, while we also provide a brief comparison with other radiolocation technologies based on WiFi and Bluetooth.
UWB was always considered a technology with the highest accuracy and also equipped with a price label in an order more than all other technologies on the market. Nowadays, commercially viable UWB projects can be delivered at almost the same price level as former technologies, and it has started to be accessible to many customers. The goal of Sewio is to provide RTLS UWB technology that will not only be great in terms of accuracy and accuracy stability, but also highly scalable in a space covering tens of thousands of square meters and able to track 5000+ tags while providing years of tag battery life. As will be discussed below, this can be done ideally if the radio signal provides good precision with minimal packet loss so an accurate tag position can be calculated even from a few transmissions, known as blinks. A blink is a message sent by a tag in a regular manner in order to be processed by the ambient readers’ known as anchors for further data processing.
What Are the Key Factors Affecting Accuracy?
The article has been written in part as a response to various questions coming from our partners and customers. We thought it would be best to answer them in the following Q&A format.
The factors can be divided into two groups: tag related and infrastructure related.
The most critical component is the tag and its correct placement, mainly due to the limited small tag antenna and also its performance variation coming from various placements in real-world applications. The key is to understand the use-case and then propose a suitable tag placement and design the anchor density near a worst-case scenario. It is important to realize that the design phase for the placement of anchors is crucial since later changes are usually very costly! There is mostly no way back – no one wants to limit production to operate with high-lift platforms again to add or change the position of anchors together with deploying new cables.
Let’s expand the list of factors. They can be divided into two groups:
Tag Related
- Tag placement
- Line-of-sight visibility from tag to anchors around is as good as possible to provide stable measurement
- Tag antenna polarization vertical vs. horizontal could provide some signal margin if an application always allows putting a tag in a given polarization, assuming that anchors are always placed within the same orientation. The difference between those two tag polarizations could be more than 6 dB, which is effectively doubling/halving the range
- Tag refresh rate – Energy spends for a single position estimate. It is the number of transmissions for the tag to be aggregated and filtered to deliver a single position on output or trigger an event over a virtual geo-fence. This is a tradeoff between higher confidence levels for accuracy vs. power consumption. (the confidence level is explained below in detail)
Infrastructure Related
- The number of anchors in the range of the tag – as a rule of thumb: 4 is usually the lower bound, 5-6 anchors would be preferred to have some redundancy, while 8+ anchors would not bring significant improvement in most industrial use-cases
- The geometry of the anchors deployed – keeping a square geometry whenever possible -> coverage by squaring the area, see the dilution of precision article.
- Correct placement of anchors
- Separation of at least 15 cm – 50 cm from the wall to minimize adverse effects on the anchor’s antenna and achieve a good line of sight visibility and possibly keep a Fresnel zone
- Anchors should be visible and not hidden behind poles
- Anchor coordinates – they must be transferred from reality to digital software within cm accuracy. Also, it is necessary to have the correct floorplans with the right dimensions and scale. This is a heavily underestimated task in practice, but ignore it, and you cannot expect to have meaningful accuracy, even with the most accurate technology
Why Is UWB More Suitable Than Other Traditional Technologies in Terms of Accuracy within an Industrial Environment?
To be fair, there is no such claim that UWB is a better technology than, for example, Bluetooth or WiFi. Each technology has its market use-case and for many of them, they can be combined to deliver the best added value and a fast return of investment.
Regarding the accuracy, there is one fundamental differentiator at the PHY level which is given by UWB by its fundamentals. UWB, thanks to its wide frequency band (>= 500 MHz), is capable of jumping over a multi-path signal reception to precisely timestamp the signal that has traveled from a tag to an anchor via a direct path. On top of this, there are more techniques that can be employed in order to deliver the final position such as Two Way Ranging or Time Difference of Arrival or Angle of Arrival.
Due to the fact that the available frequency band is quite narrow, neither Bluetooth nor WiFi can utilize very accurate timestamping on a physical level like UWB can, so they have to rely on signal strength or Angle of Arrival techniques only. Signal strength measurement can be quite unstable and inaccurate, even for office environments. Therefore, it is not very suitable for industrial applications, where conditions are much more challenging. Positioning systems based on Bluetooth where signal strength measurement is applied are typically more about the coarse position estimation or presence detection. Recently, Bluetooth positioning systems were introduced that employ the Angle of Arrival technique based on a new Bluetooth standard that performs better. Nevertheless, AoA is quite sensitive to non-line-of-sight conditions and multi-path signal propagation, which is even amplified in an industrial environment thanks to the presence of metal parts. Another problem is that errors grow with the increasing distance between the tag and the AoA anchor. Therefore, the distance between tags and anchors might be limited to a level of several meters to maintain reasonable accuracy.
In order to provide acceptable complexity for deployment and accuracy, AoA anchors are typically deployed on the ceiling. However, roof mounting is much more expensive in industrial environments since deployments at great heights increase the total cost of ownership rapidly (cabling and deployment at height, placing consoles to put anchors closer to the ground, etc). Moreover, for many industrial installations, it is not even possible. Furthermore, it is quite common that within the plant, a horizontal manipulation crane is moving and, therefore, there is no chance to place an anchor overhead.
Further to the above-mentioned points, the emerging AoA Bluetooth positioning systems, as well as the WiFi positioning systems, seem to fit office building environments or healthcare projects better where the ceiling is not higher than a few meters and accuracy, and environment requirements are more relaxed, compared to industrial use-cases.
So, Why Is Accuracy Important?
Position accuracy and its stability and system reliability are the keys to delivering applications like highly optimized material handling with visible asset traceability in manufacturing. Positioning accuracy within several meters is generally not adequate for material tracking across several zones of a plant. Zones represent stages of production and are mostly placed quite close to one another – for example, 0.5 m. Therefore, industrial-grade RTLS technology needs to be able to determine reliably that material is within the given zone even if the material has been placed on a boundary very close to the next zone. Furthermore, such technology must distinguish in forklift tracking scenarios if forklifts are just passing around the zones or entering them for a reason.
It is not possible to have a reliable real-time inventory when information about where the material has been placed is missing or incorrect, and searching for items is even more complicated when its position is shifting around the factory. For many of the industrial use-cases, a positioning system with sub-meter accuracy is a technology opener.
What Is the Confidence Level?
All positioning systems come with some level of accuracy uncertainty or measurement error. Similarly to GPS, there is typically a circle around the point of a map that shows the ambiguity of a position output. The confidence level is related to precision and tells the portion of the total positions in percentage that are within a given radius as a percentage. In other words, it also shows the stability of the measurement.
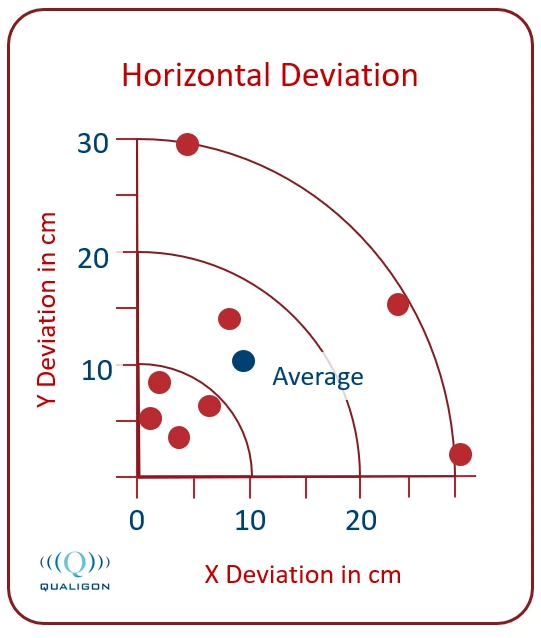
Let’s explore the accuracy and related confidence level thanks to data from a real measurement. I would like to thank our partner QUALIGON for providing the data, which was gathered in an industrial manufacturing environment within a building full of metal objects. There were line-of-sight conditions from tag to anchors during the evaluation.
The analysis shows an error of <10 cm for R70, so 70% of positions have an error within 10 cm while 98% of positions have an error 30 cm.
Let’s see in more detail a worst-case scenario in the different industrial environments within the manufacturing facility of a copper coil company.
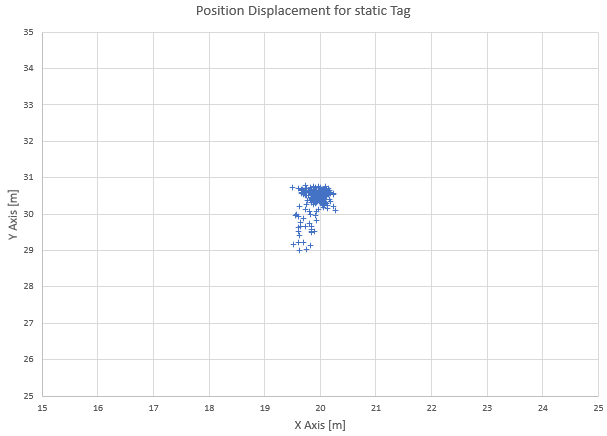
We are going to show data for a static tag placed on a metal item. We are intentionally presenting data from a setup in a medium non-line-of-sight environment, so, the tag mostly does not have direct visibility to anchors due to the machinery around. The measurement acquisition consists of hundreds of blinks from a tag within a few minutes.
Data is presented in three graphs in order to provide better insight into the results:
- The first graph shows a Cartesian X, Y position displacement within the area.
- The second graph illustrates a positioning error displacement from the true position in the box-whiskers
The third graph shows a histogram where we can see positioning error distribution. The dataset is divided into bins. This graph also uses orange to show the cumulative distribution as a percentage. This way of displaying errors is more illustrative than the confidence level shown using circles.
Static Tag, Medium Non-line-of-sight scenario
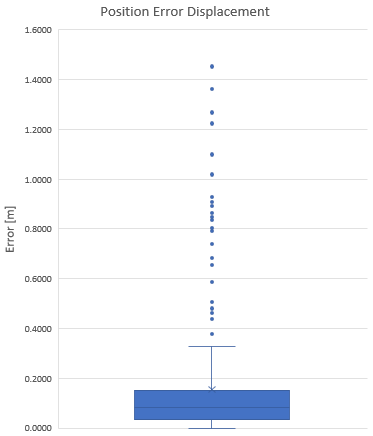
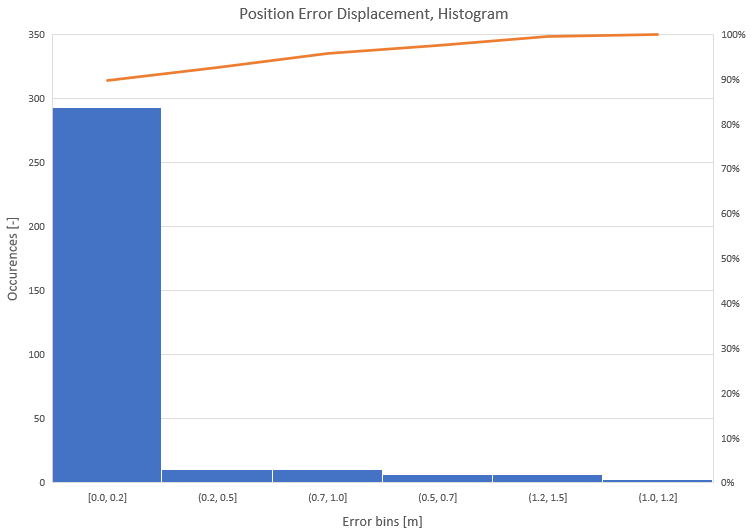
The confidence level for the data above is R95 for an accuracy error of <0.5 m. In other words, 95% of the positions have an error equal to or smaller than 50 cm.
Is It Possible to Deliver 5 cm Accuracy?
The simplified answer would be “yes for a lab environment” and ”no for real-world applications”.
Accuracy down to 5 cm is achievable but rather for demos where:
- there is a very clean open space with a line of sight between anchors and between tags and anchors
- there is frequent tag transmission and it’s high averaging on an output leading inevitably to the high-power consumption of tag
- there are a high number of anchors within a single open space and slowly moving tags
Just a change of tag orientation may introduce around a 15 cm inaccuracy since the tiny tag antenna has a non-uniform radiation pattern.
Another hidden challenge for a high-accuracy positioning system is that anchors’ coordinates within the venue must be measured and set into the location engine with very high accuracy. This might become very challenging for dozens of anchors displaced among a larger area without proper measurement techniques. A typical affordable error is around a few millimeters. However, an error might be accumulating as there is no direct visibility to all anchors from a single measurement spot because of the walls’ presence. In addition, the provided floorplans are usually not current and bring errors from a few centimeters to tens of centimeters. All these error contributors are significantly affecting the calculated final position.
To conclude, real-world industrial applications are very different from lab exercises – tag battery life is a critical metric to be controlled and, therefore, an RTLS system must rely just on only a few tag transmissions. There are usually obstacles, therefore, medium line-of-sight conditions between a tag and anchor are present. So a more realistic number is around a 30 cm error for an R95 confidence level while a sub-meter error might achieve an R99 confidence level for a properly designed anchor infrastructure.
Some Vendors Claim a Centimeter-level of Accuracy with the Same Decawave UWB Chipset While You Advertise 30 cms or even a sub-meter. How So?
Well, it is like buying a flat based just on square meter information. You can buy it without knowing additional parameters. However, you could also end up with a flat located in the basement without windows and with a shared bathroom. Without the environmental context and other conditions, it is just a valueless claim.
UWB can deliver below 10 cm accuracy for some special use-cases and a lab-like environment such as tracking robots in open areas or considering a lower confidence level like <R50. Apart from the confidence level, one should always think also about the tag lifetime and use-case for the positioning system. Sewio is advertising numbers typically for industrial applications and an R90 confidence level and higher.
What Are the Confidence Levels for the Other Positioning Technologies Available on the Market Like WiFi?
For example, there are two well-known methods using WiFi technology for positioning. One is called Fingerprinting, using the strength of the signal, and the second is known as Hyperlocation, using the Angle of Arrival technique. Down the line, we show a publicly available graph comparing the precision of Hyperlocation and Fingerprinting (RSSI) methods of positioning.
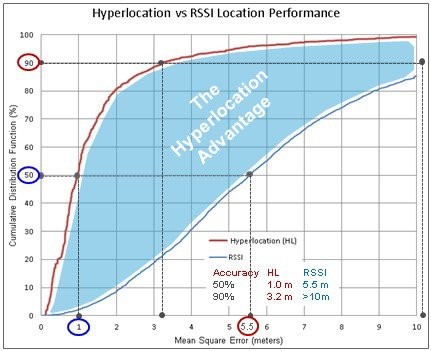
Figure 1: Error and Confidence Level, URL
The following results can be seen on the graph:
| WiFi positioning based on RSSI | R50 5.5 m error | R90 >10 m error |
| WiFi positioning based on Hyperlocation | R50 1 m error | R90 3.2 m error |
Let’s put numbers from UWB measurement into the same perspective:
| UWB positioning, TDoA, LOS | R50 0.1 m error | R98 0.3 m error |
| UWB positioning, TDoA, Medium LOS | R50 1 m error | R90 0.5 m error |
It is hard to directly compare UWB and WiFi measurements because UWB RTLS was placed in a much more challenging industrial environment, where multipath and signal reflections coming from metal objects are present. While the WiFi positioning setup was for a clear open space office.
Nevertheless, there is one important thing to realize. While accuracy numbers might appear to be interesting for R50 at first sight, they are more or less meaningless for most industrial applications. The key criterion for the industry is typically the tag battery lifetime in years. To guarantee such a lifetime, a number of transmissions must be maximally reduced, which means that even working with the coarse set of blinks, most of the blinks must feature very high precision accuracy. Therefore, the required position must be accompanied by a confidence level of R90 – and this is that unique selling point of UWB against traditional radio technologies. UWB brings sub-meter accuracy with a confidence level of around 95%.
Conclusion
We have discussed the most frequent asked accuracy-related questions. We identified and briefly discussed top factors affecting positioning performance. We have also described and explained in detail the very important confidence level parameter. Finally, we have shown UWB performance in a non-ideal industrial environment and compared WiFi and UWB positioning systems based on measurements. Based on the above mentioned, it is our conclusion that UWB can reliably deliver the sub-meter accuracy required for industrial use-cases. However, it is not just about the technology itself, but how it is designed and used. In order to achieve optimal performance, technical knowledge and expertise are required. Training, knowledge transfer and lessons learned sessions are all part of the Sewio Partner Program. We would be very delighted for you to join!